Apache Flink and the Backpressure Smackdown
03 October 2019 - CommentsFinally, Apache Flink 1.8.1 enters the cage in the Streaming Backpressure Smackdown. The second of our next-generation stream processing engines, can it get one over on Storm and Spark? Let’s see …
Enter Flink
Flink is in some ways Spark in reverse: whereas Spark views streaming as a continuous series of small batch jobs, Flink views batch as the (re)processing of some historic part of a continuous stream.
Although Flink appeared on the scene slightly behind Spark it has been first in many technical milestones, like for instance checkpointing using the Chandy-Lamport algorithm. Its technical pedigree is undeniable, and it clearly wins over Spark for low-latency applications.
And yet, it often feels like Flink has lost out to Spark, purely due to being second to emerge. However, although not as widely used as Spark, behind the scenes the likes of Alibaba and AWS have used it as a keystone piece of technology.
In fact, AWS have made it the foundation of their new Amazon Kinesis Data Analytics offering, which clearly says a lot for Flink.
Flink UI - almost awesome
The initial incarnation of the Flink UI was pretty rough around the edges. But you cannot say that about the latest edition. It looks great, and functionally it is excellent. However, one area that could be improved is the identification of hotspots within the dataflow.
The Storm UI provides a useful metric it calls capacity, which can be used to identify any bottlenecks in your flows. Although the Flink UI provides some information around backpressure, it does not seem to offer anything as useful as the capacity metric in Storm. (It would be interesting to hear any contrary opinions from experienced Flink users).
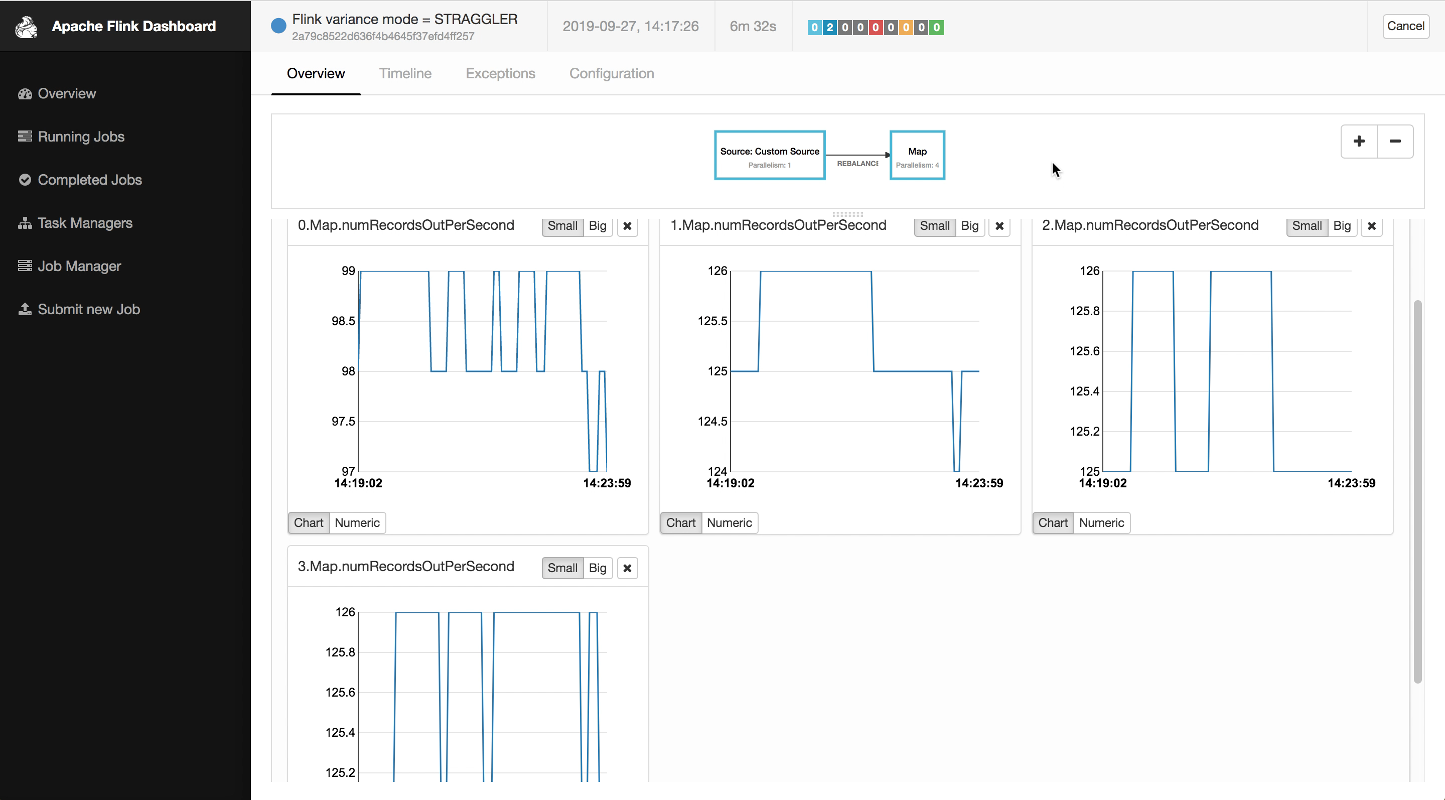
On the plus side, the Flink UI does enable you to display user selected charts based on both internal and application metrics. This is pretty neat, and would be super useful for diagnostic purposes except for the fact that it seems to be limited to displaying the last five minutes.
There are Flink configuration settings for changing the amount of metric history that is maintained. However, changing these did not seem to improve the charting situation - could just be user error on my part.
InfluxDB & Chronograf rock (total aside)
As with Storm and Spark, there was a need to push our metrics to a third-party system. Being less familiar with Flink, and having neither the desire or time to code the required interface to Elasticsearch, I decided to investigate the existing systems supported.
Fortunately, InfluxDB and Chronograf came to my rescue being both easy to install (via Brew) and highly capable.
Capability-wise Chronograf is very similar to Kibana. Arguably, the assisted SQL approach used to build visualisations may prove more accessible to many users than learning the new syntax required for Kibana.
My only quibble would be a couple of notable rough edges around the time window that need fixing in a future release:
- the drop-down options are not quite as flexible as they could be
- the time window does not update in response to browser navigation
Smack. Down.
Enough of metrics and visualisations, let’s get into smackdown. How did Flink cope with our assault course of backpressure scenarios?1
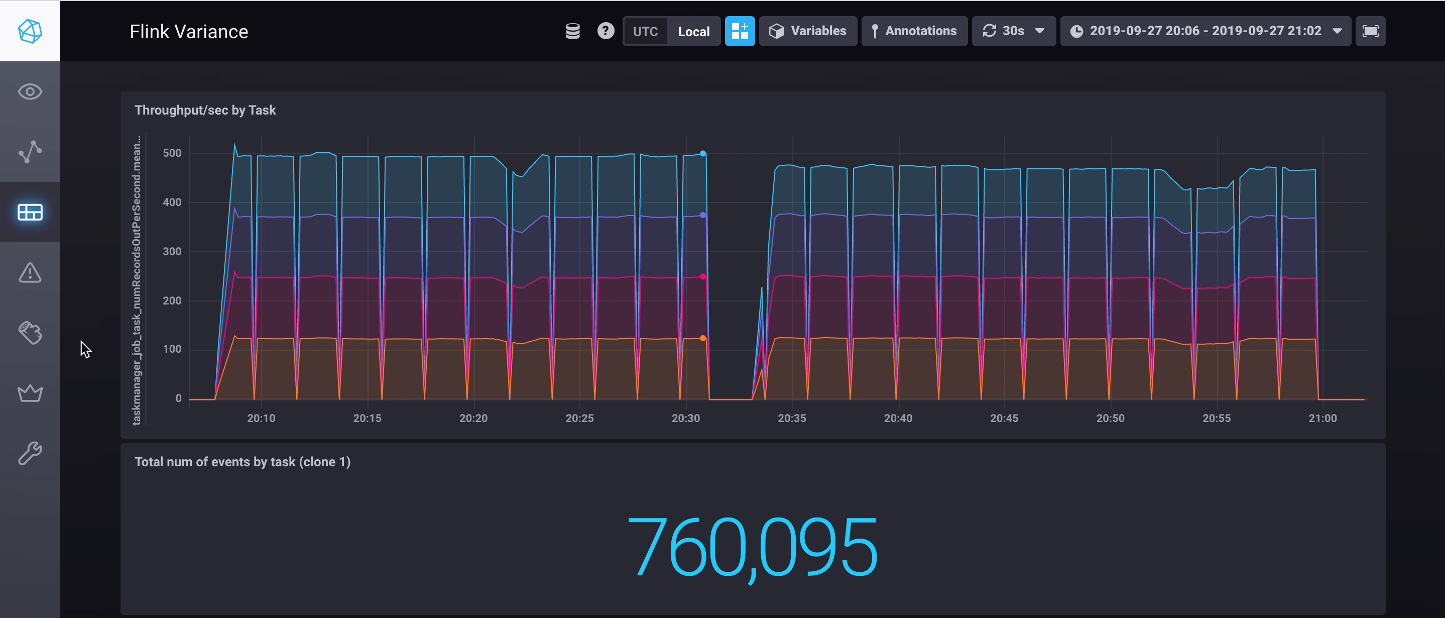
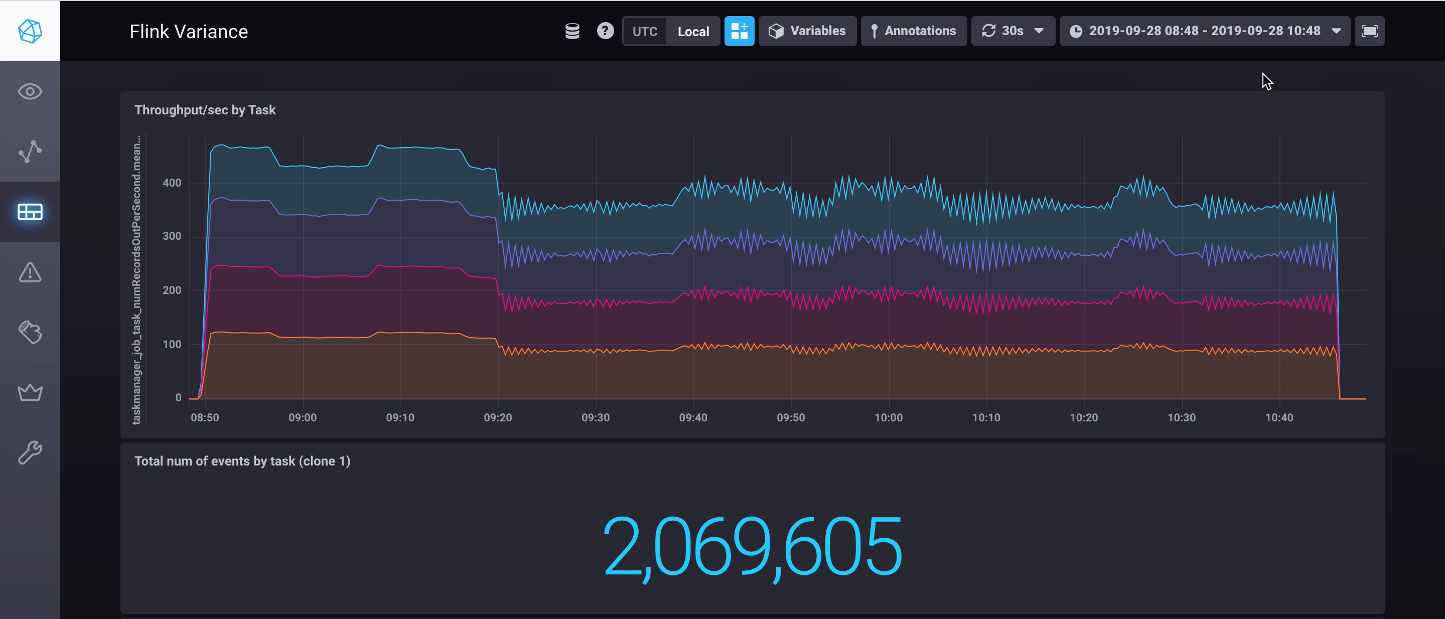
The slight straggler
First up, the slight straggler scenario: nicely done. The dashboard below shows the run of the minimal variance scenario, followed by the slight stragger. As you can see, the performance is solid2.
The bad straggler
Next up, the bad straggler scenario: solid performa … no, wait, whaaat?!!
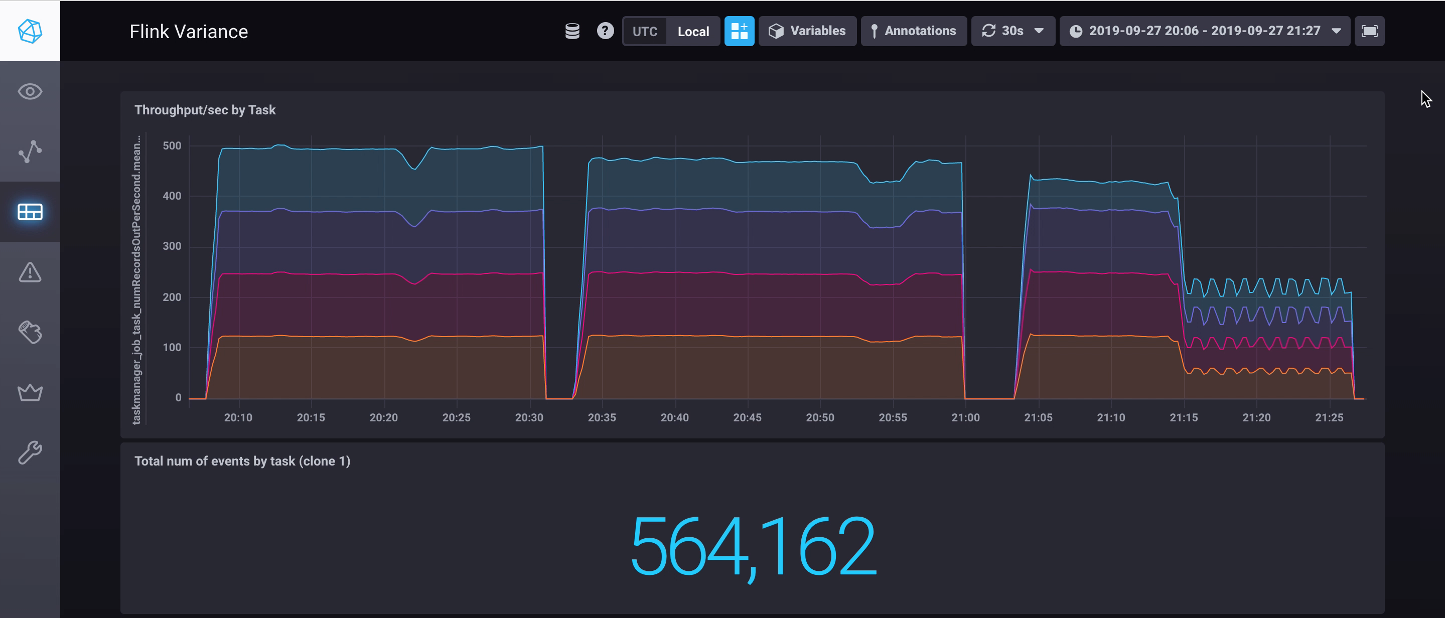
This third run starts off as expected; throughput is down on the straggling task, but the other tasks remain unaffected. Then boom, ten minutes in, the rates drop across the board to that of the straggling task.
This doesn’t bode well for …
The constant straggler
Finally, the constant straggler scenario: meh. Flink gets taken down to the mat and totally smashed by the gnarliest of our scenarios. It is not pretty.
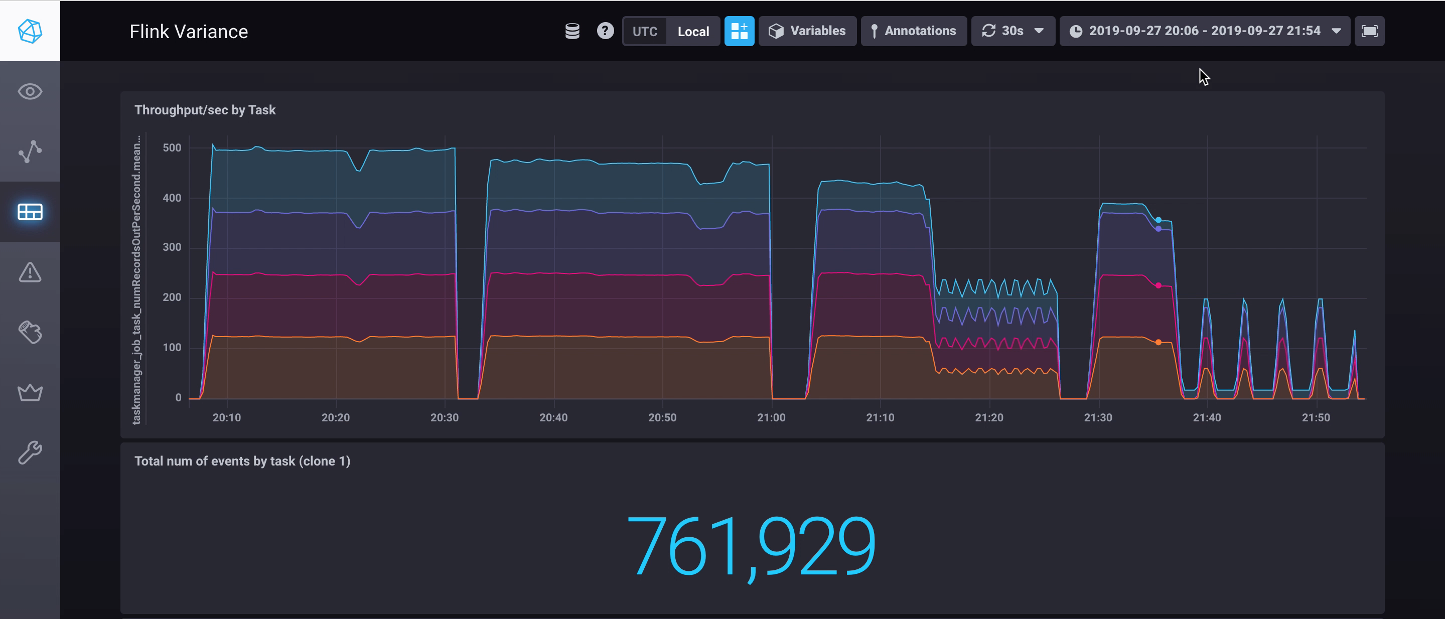
… and it only gets worse
Having seen the performances on the other scenarios I had a feeling that maybe we just got lucky with our shorter run on the slight straggler scenario. So I reran it for longer, and bam, Flink is on its knees again.
If you want to run these scenarios checkout the code in github.
Flink flunked
… or was it me? So Flink on default settings performs horribly here, which is a real surprise. Before I started, I had anticipated Flink easily out-performing the other contenders.
Given that Flink is being used widely in industry, in a vast number of production settings, it is hard to imagine that it performs as badly as it appears too. Surely, it has to be experimental error on my part?3
I have to put my hand up and say that I don’t have any production experience with Flink, so there may be something I am missing. That said, running through the Flink documentation on configuration there isn’t anything that jumps out.
I’m going to put a shout out on the Flink user mailing list. Hopefully someone will get back to me there, or in response to this post. Surely, Flink can do better than this right?
So it turns out that, yeah, Flink flunked. It flunked hard. I had a discussion on the Flink mailing list4 with a staff-engineer from Ververica (formerly Data Artisans - the creators of Flink). The paraphrased version of the conversation is that Flink does not currently cope with the scenarios from the smackdown. The argument made was that the smackdown tested a niche scenario that would not exist in properly configuring multi-tenant Hadoop environments.
I have some sympathy for this view. At the same time, I have operated in environments that were not perfectly configured multi-tenant environments. They exist. I expect, given the complexities involved in provisioning and managing multi-tenant environments, that they are more common than some would expect. That said, it is hard to quantify exactly how common these scenarios are in the wild.
So Flink flunked - what does it mean? In the next post we will review the performance of Storm, Spark and Flink and discuss what it may or may not mean for Flink to flunk.
-
See the first article in this series for a breakdown of the backpressure scenarios. ↩
-
Note, the artifacting in the chart is down to my inexperience with Chronograf rather than a problem with the incoming data. ↩
-
It is worth noting that I ran two variations of the constant straggler scenario, one with a single worker and one with four separate workers - the results were the same in both cases. ↩
-
The last few messages in the thread are a little mashed up, as I originally made the mistake of replying without including the mailing list, so the messages were replayed and included some out of order comments (e.g. the CGroups comments). ↩
Tags: Performance Flink Smackdown Big-data Data-Engineering
comments powered by Disqus